

On this page:
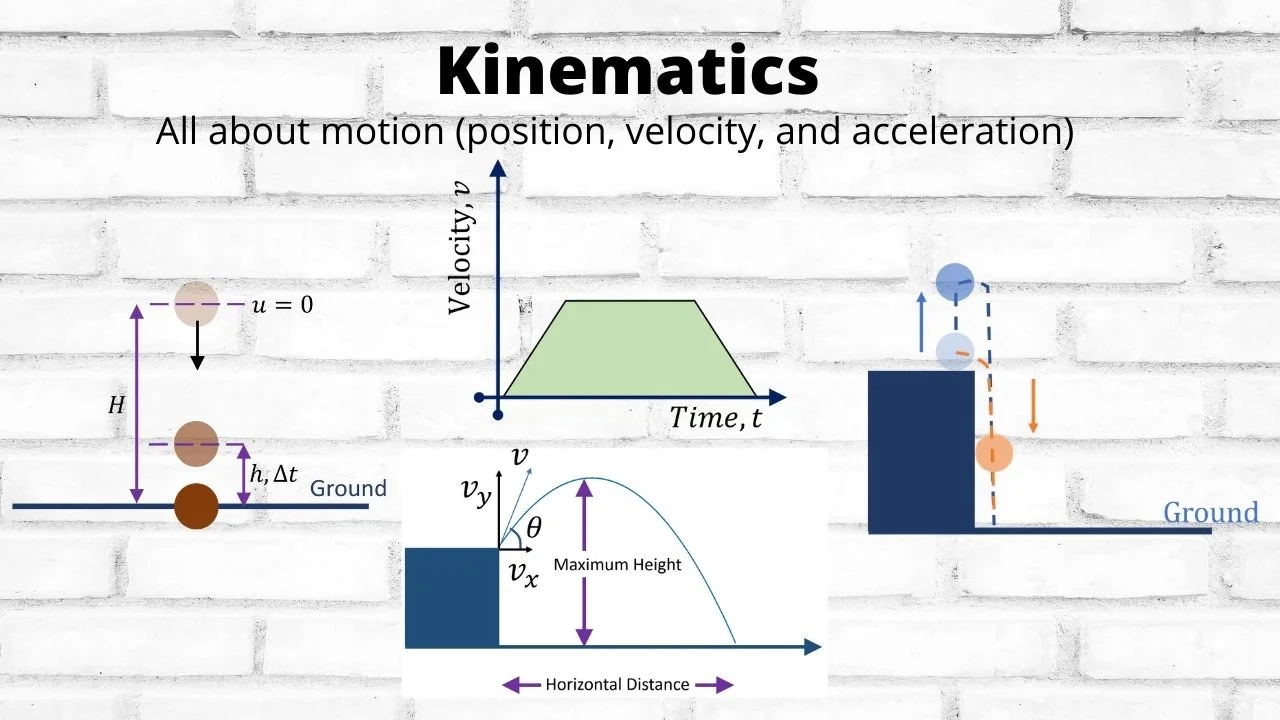
Introduction Scalars and Vectors Distance and Displacement Speed and Velocity What is Acceleration? The SUVAT Equations Motion Graphs Free Fall: Gravity in Action Projectile Motion Relative VelocityHave you seen a well-kicked football? Have you seen a car increase its velocity as it enters a highway? Have you experimented and timed how long it takes an object to fall from your hand to the ground? These examples all involve motion, and an area of study known as kinematics can help us explain this.
One thing to note is that kinematics is not about the forces involved in the motion. Kinematics is purely about describing motion: the starting point (initial point), velocity, acceleration (increasing/decreasing), distance, and travel duration.
Think of kinematics as the language needed to describe motion before you can understand the reasons for the motion.
Before we get into the details of motion, it is important to understand that, in physics, there are two types of quantities.
Number and unit only — no direction.
Examples: distance, speed, time, mass, energy
"I ran 5 kilometers" or "the test lasted 45 minutes"
Magnitude AND direction.
Examples: displacement, velocity, acceleration, force
"I walked 3 meters north"
In illustrations, vectors are shown as arrows. In writing, vectors are typically indicated by boldface print (v) or by an arrow above the symbol.
Total path length covered
Does not take direction into account
Always positive and never decreases
Example: Walk 10 m forward, 5 m back → distance = 15 m
Change in position (straight line from start to end)
Vector quantity
Example: Walk 10 m forward, 5 m back → displacement = 5 m forward
Example: Run one complete lap around a 400 m track:
How fast something is moving
Scalar quantity
Speed = total distance ÷ total time
Speed with direction
Vector quantity
Velocity = displacement ÷ time
Important: Driving at constant speed around a circular track means speed stays constant, but velocity is always changing because direction changes.
After one lap: average velocity = 0 (displacement = 0), but average speed ≠ 0.
a = (v − u) ÷ t
u = initial velocity, v = final velocity, t = time
SI unit: m/s² (meters per second squared)
Acceleration is the rate at which velocity changes.
Acceleration includes:
Example: A car moving around a corner at 40 km/h is accelerating because direction is changing.
When acceleration is constant, these five variables and four equations can be used to predict motion.
Example: A car starts from rest (u = 0). How far does it travel if it accelerates at 3 m/s² for 6 seconds? What is the final velocity?
v = u + at = 0 + (3)(6) = 18 m/s
s = ut + ½at² = 0 + ½(3)(6)² = ½(3)(36) = 54 m
Important: These equations are ONLY valid for constant acceleration.
Slope = velocity
Slope = acceleration
Area under curve = displacement
Example: Graph from 0 to 20 m/s in 5 seconds:
a = (20 - 0) ÷ 5 = 4 m/s²
s = ½ × base × height = ½ × 5 × 20 = 50 m
Area under graph = change in velocity
Constant acceleration appears as a horizontal line.
Near Earth's surface, acceleration due to gravity is approximately 9.81 m/s² (symbol: g).
Key fact: Without air resistance, all objects fall at the same rate regardless of weight (demonstrated by astronauts on the Moon).
Sign convention:
Be consistent throughout the problem.
Example: Throw a ball straight up at 25 m/s. How high does it go? (g = 10 m/s²)
At maximum height, v = 0:
v² = u² + 2as → 0 = 25² + 2(-10)s → 0 = 625 - 20s → s = 31.25 m
The key concept for solving projectile problems is to treat horizontal and vertical movements separately.
No acceleration (ignoring air resistance)
Constant velocity
vₓ = u cos θ
x = (u cos θ)t
Constant downward acceleration (a = −g)
uᵧ = u sin θ
All SUVAT equations apply
Optimal angle for maximum range: θ = 45° (since sin 90° = 1)
Example: Ball kicked at 20 m/s at 30° above horizontal. (g = 10 m/s²)
uᵧ = 20 sin 30° = 20 × 0.5 = 10 m/s
H = (10)² ÷ (2 × 10) = 100 ÷ 20 = 5 m
uₓ = 20 cos 30° = 20 × 0.866 = 17.32 m/s
T = (2 × 10) ÷ 10 = 2 s
R = 17.32 × 2 = 34.64 m
Depending on your reference frame, motion can appear different.
If object A has velocity vₐ and object B has velocity vᴃ:
Velocity of A relative to B = vₐ − vᴃ
Same direction: subtract speeds
Two cars at 90 km/h and 70 km/h → relative velocity = 20 km/h
Opposite direction: add speeds
Two trains at 60 km/h and 50 km/h → relative velocity = 110 km/h
Example: You are on a train moving east at 25 m/s. Another train moving east at 30 m/s passes you.
Relative velocity = 30 − 25 = 5 m/s east
The other train appears to move at 5 m/s.