

On this page:
Introduction Distance and Displacement Speed Velocity Acceleration Distance-time Graphs Velocity-time Graphs Uniform Motion Non-uniform Motion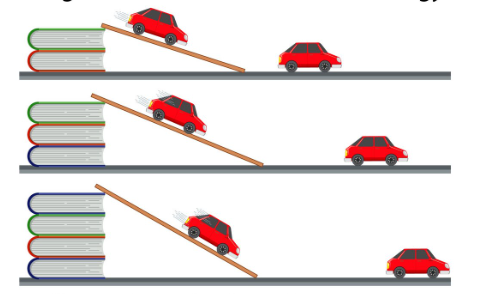
Consider your morning. You walked to the kitchen, a car passed your window, and maybe a fan was spinning. All of that is motion. But in physics, we do not just say 'it moved.' We say how far? How fast? In which direction? And how do we show this with data?
That is exactly what this lesson is about.
Before we talk about speed, we need to clear up two words that people almost always confuse.
The total path an object covers during its journey. It does not matter which direction you went; distance counts every meter traveled.
Scalar quantity (size only)
The straight-line distance from your starting point to your ending point, including direction.
Vector quantity (size and direction)
Example: Walk 8 meters to the right, then turn and walk 8 meters back to the starting point.
Total distance = 16 meters
Displacement = 0 meters (ended up at starting position)
Speed = Distance ÷ Time
SI unit: meters per second (m/s)
Example: A student runs 200 meters in 40 seconds.
Speed = 200 ÷ 40 = 5 m/s
Average speed = total distance ÷ total time. It gives total distance divided by total time, but does not describe whether the student started fast and slowed down or the other way around.
The measurement of how fast something is going is its speed — your car speedometer shows speed. As you drive, it shows different speeds. To figure out your average speed, you would use the equation given.
Velocity = Displacement ÷ Time
SI unit: meters per second (m/s) with direction
Velocity is a vector quantity. You must give the direction, e.g., 12 m/s North, 5 m/s downward.
Example: Two cars both driving at 20 m/s — one heading east, one heading west.
Same speed, different velocities: +20 m/s and -20 m/s.
Velocity will always change when there is a change in the direction of an object, even if that object is moving at a constant speed. A ball being swung in a circle is at constant speed, but its velocity is always changing because its direction is always changing.
a = (v − u) ÷ t
u = initial velocity, v = final velocity, t = time taken
SI unit: meters per second squared (m/s²)
Example: A bus starts from rest and reaches 18 m/s in 6 seconds.
a = (18 − 0) ÷ 6 = 3 m/s²
The bus gains 3 m/s of velocity every second.
One important point many students overlook is that acceleration is not just about increasing or decreasing speed. An object moving in a circle at constant speed is still accelerating because its direction is constantly changing, so velocity is constantly changing.
Acceleration is about changing velocity, not just changing speed.
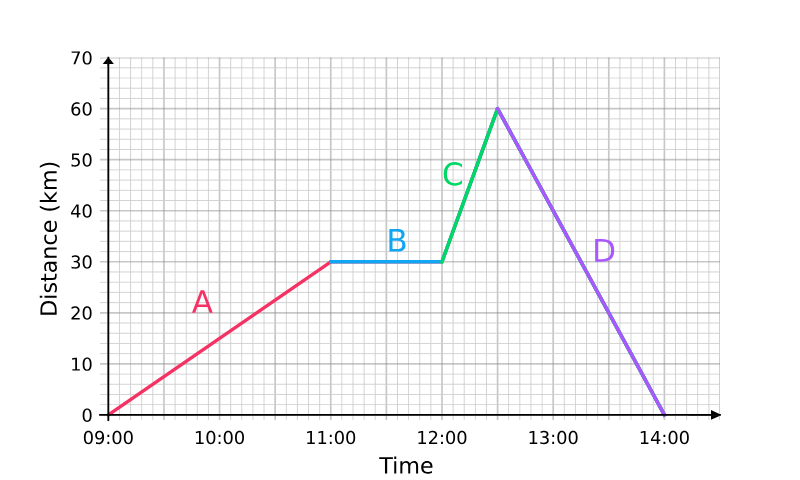
A distance-time graph shows how distance from a starting point changes with time.
| Graph Feature | What It Means |
|---|---|
| Horizontal line | Object is stationary (not moving) |
| Straight diagonal line | Constant speed (same distance in same time) |
| Steeper slope | Higher speed |
| Curve getting steeper | Speeding up (accelerating) |
| Curve getting flatter | Slowing down (decelerating) |
Slope of a distance-time graph = Speed
Speed = change in distance ÷ change in time = rise ÷ run
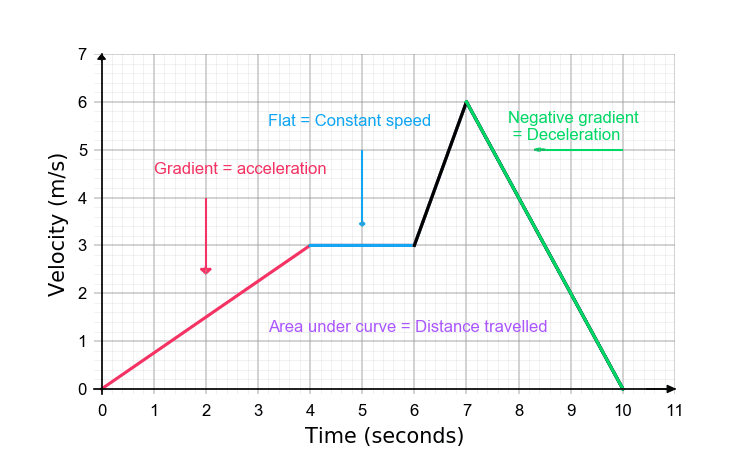
Time is on the horizontal axis, velocity on the vertical axis.
Slope of a velocity-time graph = Acceleration
Acceleration = change in velocity ÷ change in time
Area under a velocity-time graph = Distance travelled
Velocity-time graphs are very useful because both acceleration and distance can be found from one graph.
Uniform motion means the object is moving with constant velocity — same speed and direction.
Non-uniform motion is when velocity changes — speeding up, slowing down, or changing direction.
Almost everything in the real world is non-uniform motion: a car in traffic, a ball thrown upward, a biker going up a hill.
Non-uniform motion requires a force applied to the object. This causes changes to the energy present in the object. A lot of kinetic energy is associated with the motion of the object.
In order to keep the object in motion, some energy must be lost — sometimes as heat, sometimes as a drop in the object's energy. The relationship between energy and an object in motion is very important to understand.