

Every meal you have ever eaten connects you to the Sun. The energy in your food was once light energy, captured by a plant through photosynthesis, passed through one or more other organisms, and finally arrived on your plate. Follow any food chain far enough, and it always leads back to a producer converting sunlight into chemical energy.
This flow of energy through living systems is one of the most fundamental organizing principles of ecology. Food chains and food webs are the maps of that flow, showing who eats whom and revealing the hidden connections that bind every organism in an ecosystem to every other.
Every food chain begins with a producer.
Producers are organisms that manufacture their own organic molecules from inorganic raw materials using an external energy source. Almost all producers use photosynthesis, converting light energy into chemical energy stored in glucose.
Consumers obtain energy by eating other organisms. They are classified by what they eat.
Decomposers break down dead organic matter and waste products, releasing inorganic nutrients back into the environment.
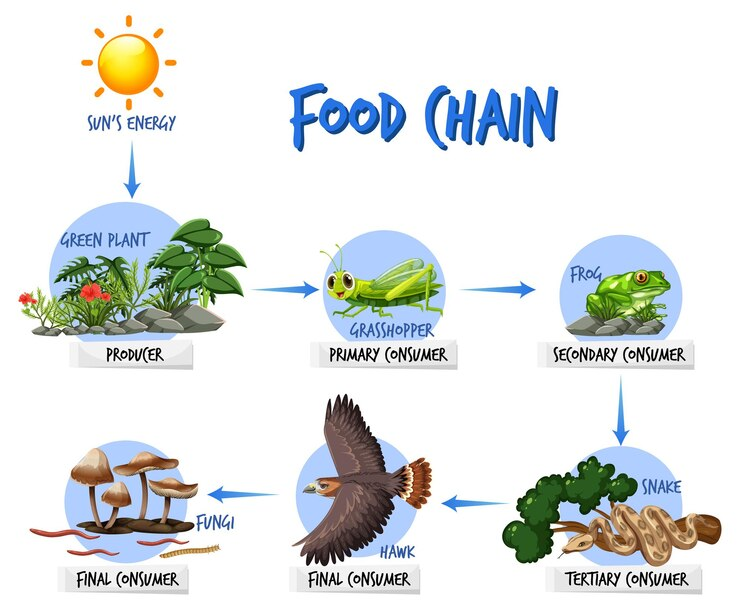
A food chain is a linear sequence showing the transfer of energy from one organism to the next through feeding relationships.
Each arrow represents the direction of energy flow and means "is eaten by."
Every food chain:
A trophic level is the position an organism occupies in a food chain based on its feeding relationship.
| Trophic Level | Organisms | Example |
|---|---|---|
| First | Producers | Phytoplankton, grass, oak trees |
| Second | Primary consumers | Zooplankton, rabbits, caterpillars |
| Third | Secondary consumers | Small fish, foxes, frogs |
| Fourth | Tertiary consumers | Large fish, eagles, owls |
| Fifth | Apex predators | Orca, tiger, great white shark |
Not all the energy at one trophic level passes to the next. In fact, most of it is lost.
When an organism is eaten, the energy in its body is used in several ways by the consumer:
Only a fraction is incorporated into new body tissue.
On average, only approximately 10 percent of the energy at one trophic level is transferred to the next. This is called the 10 percent rule.
This has important consequences:
Ecological pyramids represent the quantitative relationships between trophic levels.
Pyramid of Numbers shows the number of organisms at each trophic level. Usually decreases at higher trophic levels. Can be inverted when a large producer (one oak tree) supports many consumers (thousands of insects).
Pyramid of Biomass shows the total dry mass of living material at each trophic level. Almost always a true pyramid shape because biomass decreases at each level due to energy losses. More reliable than the pyramid of numbers.
Pyramid of Energy shows the total energy available at each trophic level. Always a true pyramid shape. Energy always decreases moving up trophic levels. This is the most accurate and informative of the three types.
In reality, most organisms eat more than one type of food and are eaten by more than one predator. A food web shows the complete network of feeding relationships in an ecosystem, connecting multiple overlapping food chains.
Food webs are far more realistic representations of energy flow than single food chains because they show:
In a food web diagram:
Food webs reveal the interconnectedness of ecosystems. Removing any species, particularly a keystone species, can destabilize the entire web.
Trophic cascade: The removal of a top predator allows prey populations to increase uncontrolled. These populations then overgraze their food source, causing vegetation to decline, which then affects all other species depending on that vegetation.
The reintroduction of wolves to Yellowstone National Park in 1995 is a documented example. Wolves reduced elk populations and changed their grazing behavior. Vegetation recovered along riverbanks. Rivers stabilized. Fish, beavers, songbirds, and many other species benefited. One predator's return transformed the entire ecosystem.
Human activity disrupts food chains and webs in several ways.