

On this page:
Q1. Mean, Median, Mode Q2. Quartiles, IQR, Outliers Q3. Basic Probability Q4. Correlation Coefficient Interpretation Q5. Sampling Methods Q6. Binomial Distribution Q7. Grouped Frequency Table Q8. Linear Regression & Correlation Q9. Conditional Probability & Independence Q10. Tree Diagram (Without Replacement) Q11. Poisson Distribution (HL) Q12. Hypothesis Testing (t-test) Q13. Normal Distribution - Finding μ and σ Q14. Markov Chains & Steady State (HL) Q15. Linear Combinations of Normal Variables (HL) Q16. Chi-squared Goodness of Fit Q17. Normal Distribution Applications Q18. Box and Whisker Plot & Outliers Q19. Regression Line & Hypothesis Testing Q20. Binomial & Geometric Distributions Q21. Continuous Probability Density Function (HL) Q22. Confidence Intervals & Hypothesis Testing Q23. Total Probability & Bayes' Theorem Q24. Non-linear Regression (Power Model) (HL)Practice questions covering descriptive statistics, probability rules, tree diagrams, binomial, Poisson, normal distributions, hypothesis testing (t-test, chi-squared), regression and correlation, confidence intervals, Bayes' theorem, Markov chains, continuous probability density functions, and non-linear regression.
The scores of 9 students: 45, 62, 58, 71, 45, 88, 53, 67, 45. Find:
(a) mean,
(b) median,
(c) mode.
Answer: (a) 59.3
(b) 58
(c) 45
Data: 12, 18, 21, 23, 25, 26, 27, 28, 30, 31, 33, 35, 38, 42. Find Q1, Q3, IQR, and any outliers.
Answer: Q1=22, Q3=33.5, IQR=11.5, no outliers
A bag has 4 red, 3 blue, 5 green balls. One ball is picked at random. Find:
(a) P(red)
(b) P(not blue)
(c) P(red or green).
Answer: (a) 1/3
(b) 3/4 (c) 3/4
The correlation coefficient r = −0.92.
(a) Describe the correlation.
(b) What does r² tell you?
(c) Can you conclude that x causes y to decrease?
Answer: (a) Strong negative linear
(b) r²≈0.846, 84.6% explained
(c) No; correlation ≠ causation
Describe the difference between:
(a) random sampling
(b) stratified sampling
(c) systematic sampling.
Answer: (a) Every member equally likely
(b) Population divided into groups, sample proportional from each
(c) Every nth member selected
X ~ B(10, 0.3). Find:
(a) P(X=3),
(b) P(X≤2),
(c) E(X) and Var(X).
Answer: (a) 0.267
(b) 0.383
(c) E(X)=3, Var=2.1
A frequency table: marks 10-20 (freq 4), 20-30 (freq 7), 30-40 (freq 12), 40-50 (freq 9), 50-60 (freq 3).
(a) Calculate the mean.
(b) Find the modal class.
(c) Estimate the median.
(d) Draw a cumulative frequency curve description and estimate Q1, Q3.
Answer: (a) 35
(b) 30-40
(c) ≈35.4
(d) Q1≈31.8, Q3≈43.6
Study time (x hrs/week) vs exam score (y): data pairs (2,45),(5,58),(7,64),(8,69),(10,75),(12,80),(14,88),(15,91).
(a) Find r using GDC.
(b) Find the regression line y=ax+b.
(c) Predict score for 9 hrs/week.
(d) Comment on reliability of prediction for 20 hrs/week.
Answer: (a) r≈0.995
(b) y=3.24x+38.1
(c) ≈67.3
(d) Extrapolation — unreliable
Events A and B: P(A)=0.4, P(B)=0.5, P(A∩B)=0.25
(a) Are A and B independent?
(b) Find P(A∪B).
(c) Find P(A|B).
(d) Draw a Venn diagram with all regions labelled.
Answer: (a) No
(b) 0.65
(c) 0.5
(d) Venn: A∩B=0.25, A only=0.15, B only=0.25, neither=0.35
A tree diagram: a box has 5 red and 3 blue balls. Two balls drawn without replacement.
(a) Draw the tree diagram.
(b) Find P(both red).
(c) Find P(exactly one of each colour).
(d) Given the second is red, find P(first was also red).
Answer: (a) Tree diagram
(b) 5/14
(c) 15/28
(d) 4/7
X ~ Po(3.5). Find
(a) P(X=4)
(b) P(X≤3)
(c) P(X≥5)
(d) Find E(X) and Var(X).
Answer: (a) 0.189
(b) 0.537
(c) 0.275
(d) E=Var=3.5
A teacher claims the mean test score is 70. A sample of 25 students gives x̄=66, s=12.
(a) State H₀ and H₁ for a two-tailed test
(b) Perform a t-test at 5% significance level
(c) State your conclusion
(d) Find the 95% confidence interval for the population mean.
Answer: (a) H₀:μ=70, H₁:μ≠70
(b) t=−1.667, not significant
(c) Fail to reject H₀
(d) (61.1, 70.9)
X~N(μ,σ²). P(X<40)=0.2 and P(X<60)=0.85. Find μ and σ.
Answer: σ≈10.65, μ≈49
Transition matrix: T=[[0.7,0.3],[0.4,0.6]]. Initial state s₀=[0.6,0.4]ᵀ
(a) Find s₁=T·s₀ and s₂=T²·s₀
(b) Find the steady state distribution
(c) Find eigenvalues of T
(d) How many steps until s is within 0.01 of steady state?
Answer: (a) s₁=[0.54,0.46], s₂=[0.516,0.484]
(b) [3/7, 4/7]
(c) λ=1, λ=0.3
(d) n=5 steps
X and Y are independent: X~N(10,4), Y~N(6,9). Let W=2X−Y+3
(a) Find E(W)
(b) Find Var(W)
(c) Find P(W>20)
(d) Find P(X+Y<20)
Answer: (a) 17
(b) 25
(c) 0.274
(d) 0.866
Chi-squared test: a die is rolled 120 times. Results: 1(18),2(22),3(25),4(17),5(16),6(22). At 5% significance level, test if the die is fair.
Answer: χ²=3.1 < 11.07; Fail to reject H₀; die appears fair at 5% level
The normal distribution graph shows X~N(68,64)
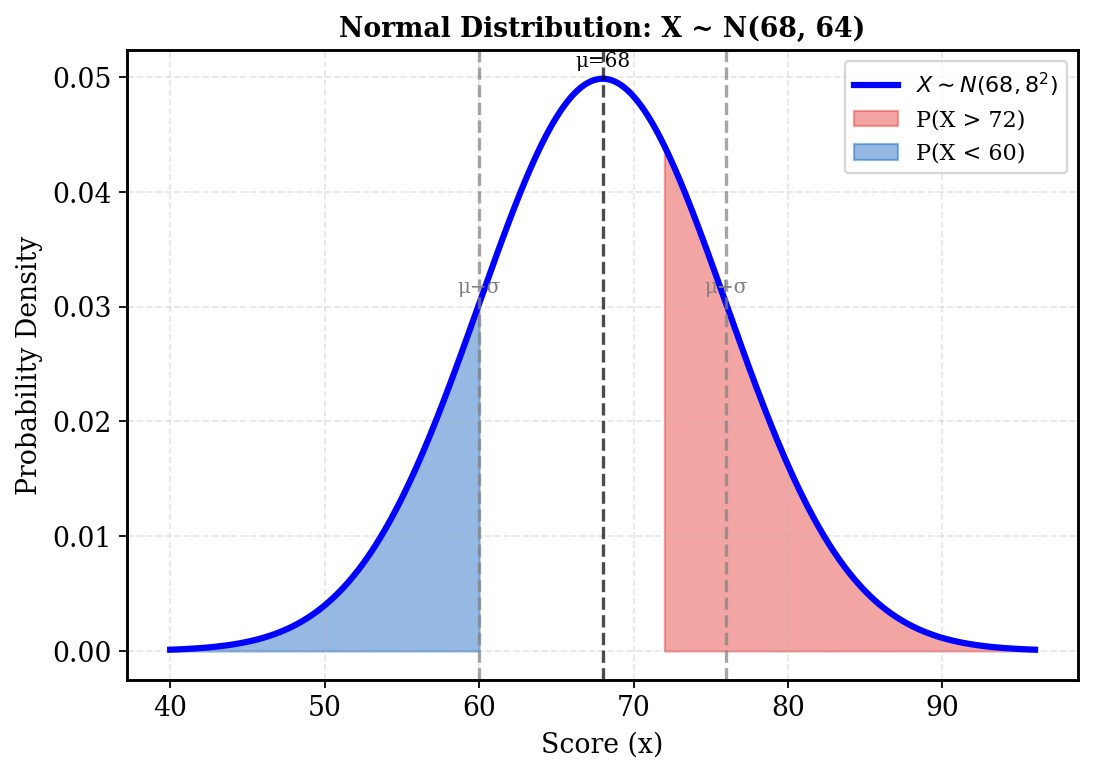
(a) Find P(X > 72) and P(X < 60) from the shaded regions.
(b) Find the value c such that P(|X−68| < c)=0.90.
(c) A student is told they are in the top 15%. Find their minimum score
(d) 5 students are randomly selected. Find P(exactly 3 score above 72).
Answer: (a) 0.309; 0.159
(b) c≈13.2
(c) ≥76.3
(d) ≈0.141
The box and whisker plot shows data with a clear outlier
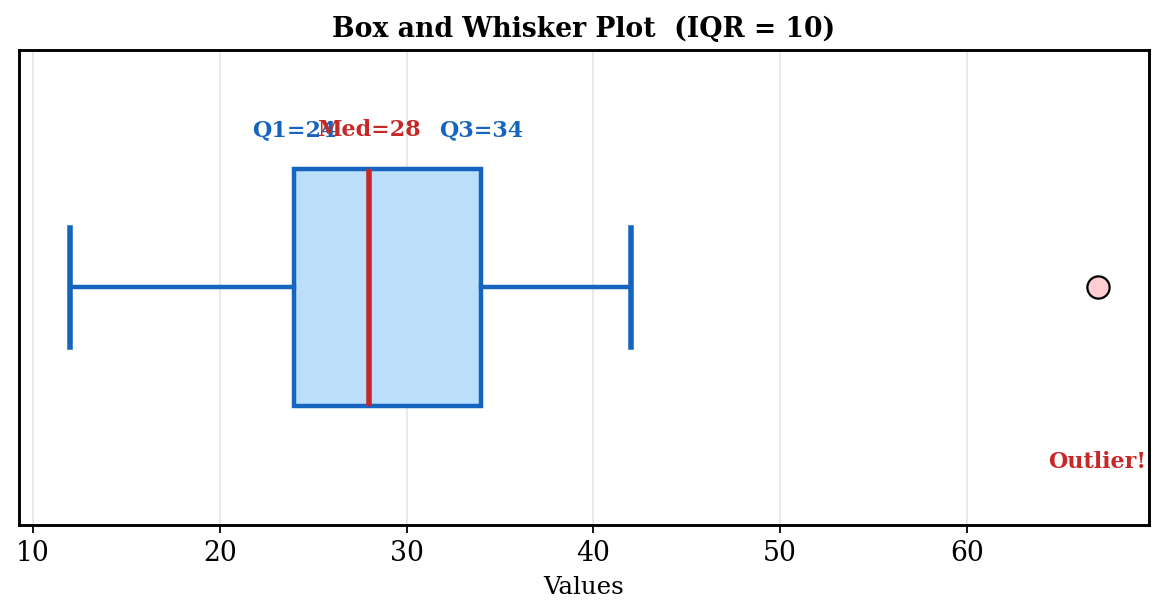
(a) Calculate Q1, Q3, IQR, and identify any outliers using the 1.5×IQR rule
(b) Compare mean vs median as measures of centre
(c) Data values: 12,18,21,23,25,26,27,28,30,31,33,35,38,42,67. Find the standard deviation using GDC
(d) Remove the outlier and recalculate mean, median, and SD. Comment on the effect.
Answer: (a) Q1=22, Q3=33.5, IQR=11.5, outlier=67
(b) Median better
(c) σ≈12.6
(d) Mean drops to 27.4, SD to 7.1
Scatter plot: study hours vs exam score, n=12. The regression line ŷ=3.24x+38.1 is shown with r=0.994
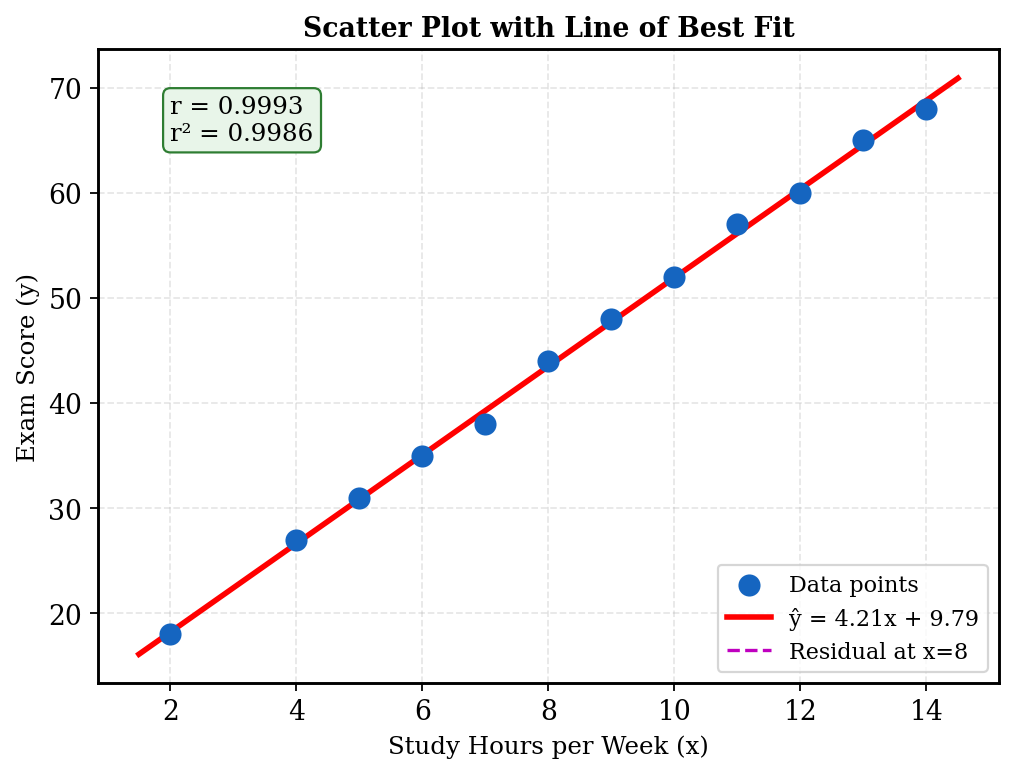
(a) Interpret the gradient 3.24 and y-intercept 38.1 in context
(b) Find the score for 11 hours. Is this interpolation or extrapolation?
(c) A student scored 82 and studied 13 hours. Find their residual and interpret
(d) [HL] Test H₀: ρ=0 vs H₁: ρ≠0 at 1% significance level given t=r√(n-2)/√(1-r²).
Answer: (a) +3.24 marks/hour; 38.1 baseline
(b) 73.7; interpolation
(c) residual=+1.8
(d) Reject H₀; significant
Binomial distribution X~B(12,0.35). The bar chart highlights P(X≥6)
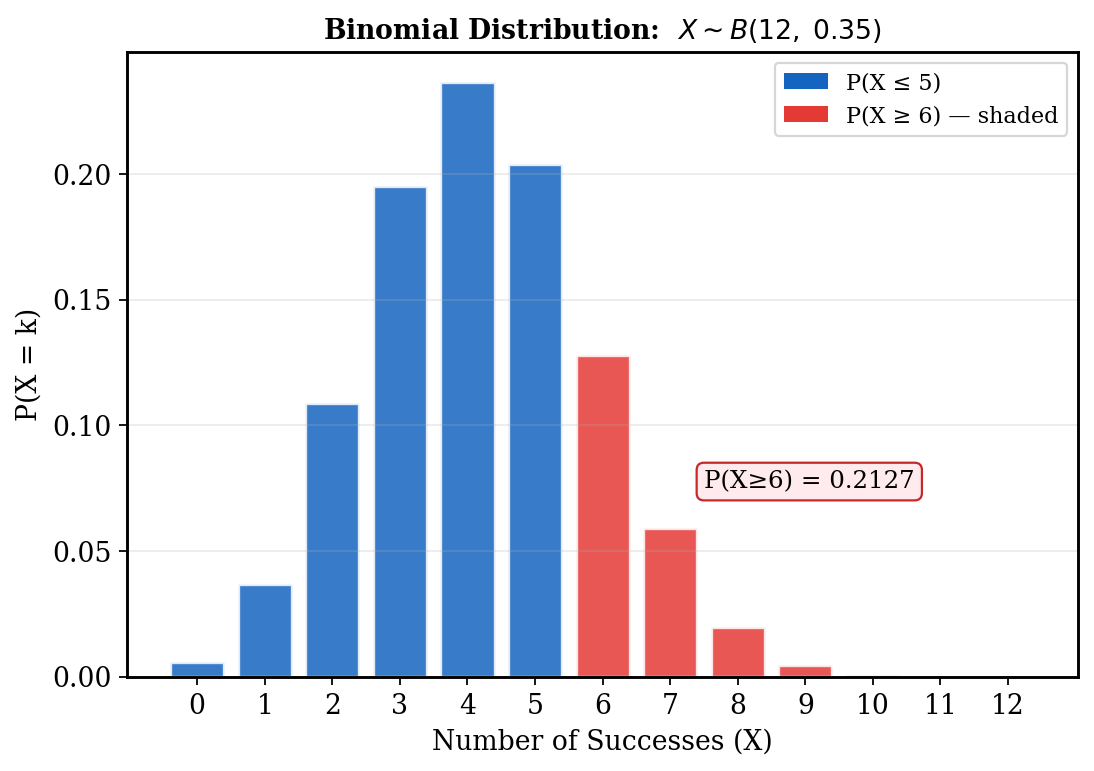
(a) Find P(X=6) and P(X≥6)
(b) Find the most likely value (mode)
(c) Find E(X), Var(X), SD(X)
(d) Y is defined as the number of trials until the first success (Geometric). If P(success)=0.35, find P(Y=5) and E(Y).
Answer: (a) P(X=6)≈0.128, P(X≥6)≈0.254
(b) Mode=4
(c) E=4.2, Var=2.73, SD=1.65
(d) P(Y=5)≈0.097, E(Y)≈2.86
Continuous probability: f(x) = kx(4−x) for 0≤x≤4, f(x)=0 otherwise
(a) Show k=3/32
(b) Find E(X) and Var(X)
(c) Find P(1 < X < 3)
(d) Find the median m such that ∫₀ᵐ f(x)dx=0.5.
Answer: (a) k=3/32 shown (1 < X < 3)
(b) E(X)=2, Var=0.8
(c) 11/16=0.6875
(d) m=2
Confidence intervals and hypothesis: A sample of 40 light bulbs has mean lifetime x̄=1200hrs, s=150hrs
(a) Find a 99% confidence interval for μ
(b) The manufacturer claims μ=1250hrs. Test this at 5% (two-tailed).
(c) What sample size n is needed for margin of error ≤20hrs at 95% confidence?
(d) A second sample of 35 bulbs gives x̄=1180, s=160. Test if the two samples have equal means at 10% level.
Answer: (a) (1139, 1261)
(b) Reject H₀
(c) n≥217
(d) Fail to reject; means not significantly different
Combined probability: Events A, B, C: P(A)=0.5, P(B|A)=0.6, P(B|A')=0.3, P(C|A∩B)=0.8, P(C|A∩B')=0.4, P(C|A'∩B)=0.5, P(C|A'∩B')=0.1.
(a) Find P(B) using total probability
(b) Find P(A|B) using Bayes
(c) Find P(C)
(d) Find P(A|C)
(e) [HL] If events are repeated independently 10 times, find P(C occurs at least 6 times).
Answer: (a) 0.45
(b) 2/3
(c) 0.43
(d) 0.744
(e) ≈0.197
Non-linear regression: data suggests model of form y=ax^b. After log transformation: ln(y)=ln(a)+b·ln(x). Data: (x,y): (1,3),(2,8.5),(3,15.6),(4,24),(5,33.7),(6,44),(7,55.8),(8,68).
(a) Transform data to (ln x, ln y)
(b) Find the linear regression of ln y on ln x via GDC
(c) Determine a and b
(d) Use model to predict y when x=10
(e) Calculate r for the transformed data and assess fit.
Answer: (a) Transform done
(b) ln y≈0.97+1.50·ln x
(c) a≈2.64, b≈1.50
(d) y≈83.5 (e) r≈0.9998