

On this page:
Q1. Mean, Median, Mode, Range Q2. Probability Rules Q3. Binomial Distribution Q4. Normal Distribution Q5. Tree Diagram - Without Replacement Q6. Regression Line & Correlation Q7. Conditional Probability & Independence Q8. Normal Distribution - Finding μ and σ Q9. Discrete Random Variable Q10. Central Limit Theorem Q11. Normal & Binomial Combined Q12. Bayes' Theorem - Three Boxes Q13. Continuous PDF (HL) Q14. Confidence Interval Q15. Bayes' Theorem - Medical Test Q16. Bivariate Data & Regression Q17. Spinner Distribution & CLT Q18. Venn Diagram & Conditional Probability Q19. Normal Distribution - Scaling Marks Q20. Total Probability & Bayes Q21. Binomial - Defective Bolts Q22. Exponential Distribution (HL) Q23. Venn Diagram - Sport & Music Q24. Hypothesis Testing Q25. Regression - Math & Science Scores Q26. Math & Science Regression (Table) Q27. Normal Distribution - Work Hours Q28. Orange Mass Normal Distribution Q29. Normal Distribution - Work Hours (Alt) Q30. Bayes' Theorem - Three Boxes (Alt) Q31. Hypothesis Test - Battery Lifetime Q32. Bayes' Theorem - Disease Test Q33. Regression - Math & Science (8 Students) Q34. Normal Distribution - Finding μ and σ (Alt) Q35. Discrete Random Variable & CLT Q36. Continuous PDF Median (HL) Q37. Normal Distribution - LightbulbsPractice questions covering descriptive statistics, probability rules, binomial and normal distributions, conditional probability, Bayes' theorem, regression, correlation, hypothesis testing, confidence intervals, and continuous probability distributions.
The data set is: 4, 7, 3, 9, 2, 8, 5, 6, 7, 9.
(a) Find the mean, median, and mode.
(b) Find the range.
(a) Mean = 60/10 = 6; Sorted: 2,3,4,5,6,7,7,8,9,9 → Median = (6+7)/2 = 6.5; Mode = 7 and 9
(b) Range = 9−2 = 7
P(A) = 0.4, P(B) = 0.5, P(A∩B) = 0.2.
(a) Find P(A∪B).
(b) Find P(A|B).
(a) P(A∪B) = 0.4+0.5−0.2 = 0.7
(b) P(A|B) = 0.2/0.5 = 0.4
X ~ B(10, 0.3). Find:
(a) P(X = 3).
(b) P(X ≤ 2).
(c) E(X) and Var(X).
(a) P(X=3) = C(10,3)(0.3)³(0.7)⁷ = 0.2668
(b) P(X≤2) = 0.3828
(c) E(X) = 3; Var(X) = 2.1
X ~ N(μ=50, σ=8). Find P(42 < X < 62).
z₁ = (42−50)/8 = −1, z₂ = (62−50)/8 = 1.5
P(−1 < Z < 1.5) = Φ(1.5) − Φ(−1) = 0.9332 − 0.1587 = 0.7745
A bag contains 5 red and 3 blue balls. Two are drawn without replacement.
(a) Draw a tree diagram.
(b) Find P(both same colour).
(a) Tree: R(5/8)→R(4/7): RR, R→B(3/7): RB; B(3/8)→R(5/7): BR, B→B(2/7): BB
(b) P(same) = (5/8)(4/7) + (3/8)(2/7) = 20/56 + 6/56 = 26/56 = 13/28
The regression line of y on x for a bivariate data set is y = 2.4x + 1.5. The mean of x is 5.
(a) Find the mean of y.
(b) Given r = 0.95, comment on the relationship.
(c) Use the regression line to predict y when x = 8. Comment on reliability.
(a) ȳ = 2.4(5) + 1.5 = 13.5
(b) r = 0.95 indicates a strong positive linear correlation.
(c) ŷ = 2.4(8)+1.5 = 20.7. Reliable if x=8 within data range (interpolation).
Events A and B are such that P(A)=0.6, P(B)=0.5 and P(A'∩B')=0.1.
(a) Find P(A∪B).
(b) Find P(A∩B).
(c) Determine whether A and B are independent.
(a) P(A∪B) = 1−0.1 = 0.9
(b) P(A∩B) = 0.6+0.5−0.9 = 0.2
(c) P(A)P(B)=0.3 ≠ 0.2 → NOT independent
X ~ N(μ, σ²). P(X < 60) = 0.8 and P(X < 45) = 0.25.
(a) Write two equations using z-scores.
(b) Find μ and σ.
(a) (60−μ)/σ = 0.8416; (45−μ)/σ = −0.6745
(b) 15/σ = 1.5161 → σ = 9.89; μ = 60 − 0.8416(9.89) = 51.7
A discrete random variable X has distribution: x:1,2,3,4,5 with P(X):0.1,0.3,k,0.2,0.1.
(a) Find k.
(b) Find E(X) and E(X²).
(c) Find Var(X) and standard deviation.
(a) k = 0.3
(b) E(X) = 2.9; E(X²) = 9.7
(c) Var(X) = 1.29; SD = 1.136
X ~ N(μ=100, σ=15).
(a) Find P(score above 120).
(b) Top 10% receive distinction. Find minimum distinction score.
(c) Sample of 25 students. Find P(sample mean > 105) using CLT.
(a) z=1.33 → P=0.0918
(b) z=1.282 → x=119.2 ≈ 119
(c) Sample mean ~ N(100,9); z=1.667 → P≈0.0478
A factory produces lightbulbs with lifetimes X ~ N(1200, 100²) hours.
(a) Find P(X > 1350).
(b) 5% of bulbs are rejected for lasting less than h hours. Find h.
(c) A box of 20 bulbs. Find P(at least 18 work > 1000 hours).
(d) Find E(number of defective bulbs in a batch of 500).
(a) z=1.5 → P=0.0668
(b) z=−1.645 → h=1035.5 hours
(c) P(X>1000)=0.9772; Y~B(20,0.9772); P(Y≥18)≈0.928
(d) E=500×0.05=25 bulbs
Three boxes contain coloured balls: Box A: 3 red, 2 white; Box B: 1 red, 4 white; Box C: 2 red, 3 white. A box is chosen at random, then a ball is drawn.
(a) Find P(red ball is drawn).
(b) Given a red ball was drawn, find P(it came from Box A).
(c) [HL] Verify using Bayes' theorem.
(a) P(R) = (1/3)(3/5)+(1/3)(1/5)+(1/3)(2/5) = 6/15 = 2/5
(b) P(A|R) = (3/5)(1/3)/(2/5) = 1/2
(c) Bayes: P(A|R) = (3/15)/(6/15) = 1/2 ✓
A continuous random variable X has PDF: f(x) = kx(4−x²) for 0 ≤ x ≤ 2, and 0 otherwise.
(a) Find k.
(b) Find the CDF F(x).
(c) Find the median.
(a) ∫₀² kx(4−x²)dx = 4k = 1 → k = 1/4
(b) F(x) = x²/2 − x⁴/16
(c) m²/2 − m⁴/16 = 0.5 → m ≈ 1.082
The heights of students follow a normal distribution. A sample of 8 students has heights: 165,170,172,168,175,162,178,169.
(a) Find the sample mean and standard deviation.
(b) Estimate the population mean with 95% confidence interval.
(c) Comment on whether your sample is representative.
(a) x̄ = 169.875, s ≈ 5.17
(b) CI: 169.875 ± 2.365(5.17/√8) = (165.6, 174.2)
(c) Sample size of 8 is small; may not represent full population well.
A disease affects 1% of a population. A test is 95% accurate (sensitivity) and 90% specific.
(a) Define sensitivity and specificity.
(b) Find P(positive test result).
(c) Find P(has disease | positive test).
(d) Comment on the result.
(a) Sensitivity = P(+|D)=0.95; Specificity = P(−|D')=0.90
(b) P(+) = 0.95(0.01)+0.10(0.99) = 0.1085
(c) P(D|+) = 0.0095/0.1085 ≈ 0.0876 ≈ 8.8%
(d) Only ~8.8% chance of having disease despite positive test. False positives dominate.
Bivariate data: study hours (x) and exam score (y) for 6 students: x:2,3,5,6,8,9; y:40,50,65,70,80,85.
(a) Find Pearson correlation coefficient r.
(b) Find regression line y on x.
(c) Predict score for 7 hours. Interpolation or extrapolation?
(a) r ≈ 0.991
(b) ŷ = 6.267x + 30.53
(c) ŷ(7)=74.4; Interpolation (7 within range 2-9)
A spinner has outcomes 1,2,3,4 with probabilities 0.1,0.2,0.3,0.4.
(a) Verify valid distribution.
(b) Find E(X) and Var(X).
(c) Spun 100 times. Using CLT, approximate P(total score > 310).
(a) 0.1+0.2+0.3+0.4=1 ✓
(b) E(X)=3, Var(X)=1
(c) T~N(300,100); P(T>310)=P(Z>1)=0.1587
Venn diagram: U=30 students. A={maths}=18, B={physics}=15, A∩B=8.
(a) Draw and complete Venn diagram.
(b) Find P(A only).
(c) Find P(A|B').
(d) [HL] Are A and B independent?
(a) A only:10, B only:7, both:8, neither:5
(b) P(A only)=10/30=1/3
(c) P(A|B')=10/15=2/3
(d) P(A)P(B)=0.3; P(A∩B)=0.267 ≠ 0.3 → not independent
Scores in a class test follow N(72,12²). Pass mark is 60.
(a) Find probability a randomly chosen student passes.
(b) In class of 30, expected number who fail.
(c) Using binomial, find P(exactly 5 students fail).
(d) New pass rate should be 90%. Find new pass mark.
(a) P(pass)=0.8413
(b) E(fail)=30×0.1587≈4.76
(c) P(Y=5)≈0.181
(d) z=−1.282 → p=72−15.4=56.6 → new pass mark≈57
Events A,B,C are mutually exclusive and exhaustive with P(A)=0.3,P(B)=0.45,P(C)=0.25. P(D|A)=0.4,P(D|B)=0.2,P(D|C)=0.6.
(a) Find P(D).
(b) Find P(B|D).
(c) Find P(A'|D).
(a) P(D)=0.12+0.09+0.15=0.36
(b) P(B|D)=0.09/0.36=0.25
(c) P(A|D)=0.12/0.36=1/3; P(A'|D)=2/3
A machine makes bolts. 2% are defective. Bolts sampled in batches of 50.
(a) State suitable distribution and justify.
(b) Find P(no defective bolts).
(c) Find P(more than 2 defective).
(d) Adjusted: 1% defective. How many bolts for P(at least one defective) > 0.9?
(a) X~B(50,0.02); fixed n, independent, constant p, two outcomes
(b) P(X=0)=0.364
(c) P(X>2)=1−P(0)−P(1)−P(2)=0.078
(d) 1−(0.99)ⁿ > 0.9 → n=230
X is a continuous random variable with PDF f(x) = ce^(−2x) for x ≥ 0.
(a) Find c.
(b) Find P(1 < X < 3).
(c) Find the mean and variance of X.
(d) Sketch f(x) and describe the distribution.
(a) ∫₀^∞ ce^(−2x)dx = c/2 = 1 → c = 2
(b) P= e^(−2)−e^(−6) ≈ 0.132
(c) E(X)=1/2, Var(X)=1/4
(d) Exponential decay curve, starting at f(0)=2, decreasing toward 0.
In a school, 60% play sport, 45% study music, 25% do neither.
(a) Find P(does both).
(b) Draw a Venn diagram.
(c) Find P(sport only | does at least one activity).
(a) P(S∩M)=0.6+0.45−0.75=0.30
(b) S only:0.30, M only:0.15, both:0.30, neither:0.25
(c) P(S only|at least one)=0.30/0.75=0.40
A manufacturer claims mean battery lifetime is 200 hours. Sample of 36 batteries has mean 195, SD=18.
(a) Perform a hypothesis test at 5% significance level (two-tailed).
(b) State Type I and Type II errors in context.
(a) z = (195−200)/(18/6)=−1.667; |z|<1.96 → Fail to reject H₀.
(b) Type I: Rejecting H₀ when μ=200. Type II: Not rejecting H₀ when μ≠200.
Scatter plot of 8 data points with positive linear trend. x:10,15,20,25,30,35,40,45; y:21,30,38,45,55,60,72,80.
(a) Calculate Σx, Σy, Σx², Σxy.
(b) Find the regression line y = ax + b.
(c) Interpret the gradient.
(d) Find r and comment.
(a) Σx=220, Σy=401, Σx²=7300, Σxy=12760
(b) a=1.386, b=12.01 → ŷ = 1.386x + 12.01
(c) For each additional unit of x, y increases by about 1.386.
(d) r≈0.999 → very strong positive linear relationship.
The following table shows the Mathematics test scores (x) and the Science test scores (y) for a group of eight students.
| Mathematics scores (x) | 64 | 68 | 72 | 75 | 80 | 82 | 85 | 86 |
| Science scores (y) | 67 | 72 | 77 | 76 | 84 | 83 | 89 | 91 |
The regression line of y on x for this data can be written in the form y = ax + b.
(a) Find the value of a and the value of b.
(b) Write down Pearson's product-moment correlation coefficient, r.
(c) Use the equation of your regression line to predict the Science test score for a student who has a score of 78 on the Mathematics test. Express your answer to the nearest integer.
(a) a=1.01, b=2.45 → ŷ = 1.01x + 2.45
(b) r=0.981
(c) ŷ(78)=1.01(78)+2.45≈81
The time worked T, in hours per week, is normally distributed with mean 42 and standard deviation 10.7.
(a) Find the probability that an employee selected at random works more than 40 hours per week.
(b) A group of four employees is selected at random. Each employee is asked in turn whether they work more than 40 hours per week. Find the probability that the fourth employee is the only one in the group who works more than 40 hours per week.
A large group of employees work more than 40 hours per week.
(c)(i) An employee is selected at random from this large group.
Find the probability that this employee works less than 55 hours per week.
(c)(ii) Ten employees are selected at random from this large group.
Find the probability that exactly five of them work less than 55 hours per week.
It is known that P(a ≤ T ≤ b) = 0.904 and that P(T > b) = 2P(T < a), where a and b are numbers of hours worked per week. An employee who works fewer than a hours per week is considered to be a part-time employee.
(d) Find the maximum time, in hours per week, that an employee can work and still be considered part-time.
(a) P(T>40)=0.574
(b) P=0.0444
(c)(i) 0.888
(c)(ii) 0.00245
(d) a≈22.2 hours/week
The mass M, in grams, of oranges is normally distributed with mean μ. The table below shows probabilities for values of M.
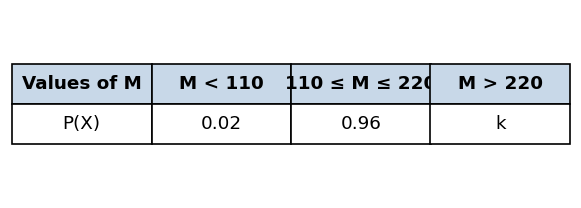
(a) (i) Write down value of k.
(ii) Show μ=165.
(b) Find P(M < 120).
The oranges are packed in boxes of 15. Any orange with mass less than 120 g is classified as small.
(c) Find the probability that a box of oranges selected at random contains at most 2 small oranges.
A wooden crate contains 20 boxes of oranges.
(d) (i) Find the expected number of boxes that contain at most 2 small oranges.
(ii) Find the probability that at least 18 boxes contain at most 2 small oranges.
(a)(i) k=0.02
(a)(ii) μ=(110+220)/2=165 ✓
(b) P(M<120)=0.0832
(c) P(X≤2)≈0.736
(d)(i) E=20×0.736=14.7
(d)(ii) P(Y≥18)≈0.127
The time worked T, in hours per week, by employees is N(42, 10.7²).
(a) Find the probability that an employee selected at random works more than 40 hours per week.
(b) A group of 4 employees is selected at random, each asked if they work more than 40 hours. Find the probability that the 4th employee is the only one who works more than 40 hours.
(c) (i) An employee is selected from those working more than 40 hours. Find the probability this employee works less than 55 hours per week.
(c)(ii) 10 employees are selected from those working more than 40 hours. Find P(exactly 5 work less than 55 hours).
It is known that P(a ≤ T ≤ b) = 0.904 and P(T > b) = 2P(T < a). An employee working fewer than a hours is part-time.
(d) Find the maximum hours per week for a part-time employee.
(a) 0.574
(b) 0.0444
(c)(i) 0.888
(c)(ii) 0.00245
(d) a≈22.2 hours
Three boxes contain coloured balls:
Box A: 3 red, 2 white. Box B: 1 red, 4 white. Box C: 2 red, 3 white.
A box is chosen at random, then a ball is drawn.
(a) Find P(red ball is drawn).
(b) Given a red ball was drawn, find P(it came from Box A).
(c) Verify using Bayes' theorem.
(a) P(R)=2/5
(b) P(A|R)=1/2
(c) Bayes: (3/15)/(6/15)=1/2 ✓
A manufacturer claims battery lifetime is N(200, 18²) hours. A sample of 36 batteries has mean 195 hours.
(a) Perform a two-tailed hypothesis test at the 5% significance level.
(b) State Type I and Type II errors in context.
(c) Find the p-value of the test and interpret it.
(a) z=−1.667, |z|<1.96 → Fail to reject H₀.
(b) Type I: Reject when μ=200; Type II: Not reject when μ≠200.
(c) p-value≈0.0956>0.05 → consistent with H₀.
A disease affects 1% of a population. A test has 95% sensitivity and 90% specificity.
(a) Define sensitivity and specificity in this context.
(b) Find P(positive test result).
(c) Find P(has disease | positive test). Comment on the result.
(a) Sensitivity = P(+|D)=0.95; Specificity = P(−|D')=0.90
(b) P(+)=0.1085
(c) P(D|+)≈0.0876 ≈ 8.8%
(d) Only ~9% chance of disease despite positive test. False positives dominate.
Mathematics scores (x) and Science scores (y) for 8 students:
x: 64, 68, 72, 75, 80, 82, 85, 86 y: 67, 72, 77, 76, 84, 83, 89, 91
(a) Find regression line y = ax + b.
(b) Write down r.
(c) Predict the Science score for a student with Mathematics score 78. State whether this is interpolation or extrapolation.
(a) a≈1.01, b≈2.45 → ŷ=1.01x+2.45
(b) r≈0.981
(c) y≈81; Interpolation (78 within 64-86)
X ~ N(μ, σ²). P(X < 60) = 0.80 and P(X < 45) = 0.25.
(a) Write two equations using z-scores.
(b) Find μ and σ.
(c) Find P(50 < X < 70).
(a) (60−μ)/σ=0.8416; (45−μ)/σ=−0.6745
(b) σ≈9.89, μ≈51.7
(c) P≈0.536
A discrete random variable X has the distribution: x = 1,2,3,4,5 with P(X=x) = 0.1, 0.3, k, 0.2, 0.1.
(a) Find k.
(b) Find E(X) and Var(X).
(c) The spinner is spun 100 times. Using the CLT, approximate P(total score > 310).
(a) k=0.3
(b) E(X)=2.9, Var(X)=1.29
(c) T~N(290,129); P(T>310)=P(Z>1.76)≈0.039
A continuous random variable X has PDF f(x) = kx(4 − x²) for 0 ≤ x ≤ 2, and 0 otherwise.
(a) Find k.
(b) Find CDF f(x) for 0≤x≤2.
(c) Find the median.
(d) Find E(X).
(a) k=1/4
(b) F(x)=x²/2 − x⁴/16
(c) m≈1.08
(d) E(X)=16/15≈1.07
A factory produces lightbulbs with lifetimes X ~ N(1200, 100²) hours.
(a) Find P(X > 1350).
(b) 5% of bulbs rejected for lasting less than h hours. Find h.
(c) A box of 20 bulbs is tested. Find P(at least 18 work longer than 1000 hours).
(a) 0.0668
(b) h≈1035.5 hours
(c) P≈0.929