

On this page:
Population Distribution: Where Do People Live? Factors Influencing Population Distribution Key Demographic Indicators The Demographic Transition Model (DTM) Population Pyramids An Aging Population A Youthful Population Migration: Moving People, Changing Places Pro-Natalist & Anti-Natalist Policies ConclusionEight billion people share this planet. But they do not share it equally.
Some parts of the Earth hold hundreds of people per square kilometer. Others hold almost none. Some countries are struggling to manage explosive population growth. Others are quietly terrified that their populations are shrinking too fast. Understanding why people live where they do, and how those numbers are changing, is one of the oldest and most important questions in all of geography.
Population geography is not just about counting people. It is about understanding the forces, physical, economic, political, and cultural, that determine where human life concentrates, how fast it grows or declines, and what happens when those patterns change faster than societies can adapt.
Population distribution refers to how people are spread across the Earth's surface. It is extremely uneven. Approximately 90% of the world's population lives in the Northern Hemisphere. Around 60% live in Asia alone. Meanwhile, vast stretches of desert, tundra, mountain, and rainforest are almost empty of permanent human settlement.
Measuring Population Distribution
Population density is the standard measure of how concentrated a population is. It is calculated as: Population density = Total population ÷ Total land area (people per km²). This gives a useful starting point, but can be misleading. Egypt has a low average population density because most of its territory is the Sahara Desert, but the Nile Delta and Valley, where almost all Egyptians actually live, are among the most densely populated areas on Earth. Physiological density, which measures population relative to agricultural land rather than total land, gives a more meaningful picture in such cases.
Why do people live where they do? The answer lies in a combination of physical and human factors.
Human Factors Shaping Population Distribution:
Population Change: The Basics
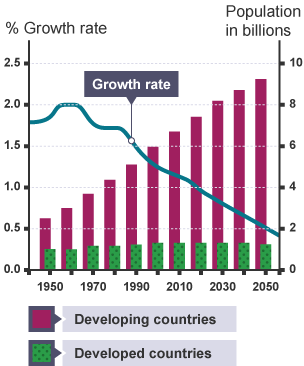
A population changes through three processes: births, deaths, and migration. Natural increase is the difference between the birth rate and death rate, expressed per 1,000 people per year: Natural increase = Birth rate − Death rate. When the birth rate exceeds the death rate, the population grows through natural increase. When the death rate exceeds the birth rate, the population experiences a natural decrease.
The Demographic Transition Model is one of the most important models in Geography. It describes how birth rates and death rates change as countries develop economically, and how those changes affect population size.
Both birth and death rates high. Population stable at low level. Pre-industrial societies. No country remains in Stage 1 today.
Death rates fall rapidly (sanitation, vaccines, food security). Birth rates remain high. Rapid population growth. Many sub-Saharan African countries are in this stage.
Birth rates begin to fall (urbanization, women's education, family planning). Population continues to grow at slowing rate. India and much of South/Southeast Asia are in this stage.
Both birth and death rates low. Population stabilizes at high level. Most high-income countries (USA, Australia, France) are in Stage 4.
Birth rates fall below death rates. Population begins to decline naturally. Japan, Germany, Italy, and South Korea are in or approaching Stage 5.
Limitations of the DTM: Developed based on European experience; may not accurately describe all countries. Does not account for migration. Some countries have moved through transition much faster. Does not explain why some countries stall in Stage 2.
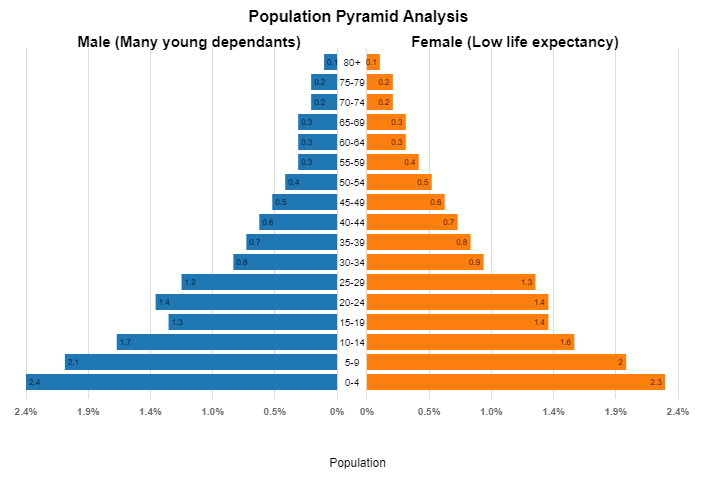
A population pyramid is a graphical representation of a population's age and sex structure. Males are typically shown on the left, females on the right, with age groups from youngest at bottom to oldest at top. The shape reveals which stage of the demographic transition a country is in.
Population pyramids are powerful planning tools, allowing governments to anticipate future demands for schools, hospitals, housing, and pension systems.
Many high-income countries face the challenge of population aging — an increasing proportion of the population is elderly, while the working-age proportion is shrinking.
Causes: Falling fertility rates (fewer children), rising life expectancy (people live longer), and the passage of the baby boom generation into retirement.
While high-income countries manage aging, many low-income countries, particularly in sub-Saharan Africa, face the challenges and opportunities of youthful populations.
Challenges: Youth bulge creates pressure for job creation, demand for education expansion, heavy demand for maternal and child health services, and food security pressures.
The Demographic Dividend: When a country moves from Stage 2 to Stage 3, with falling birth rates and a large working-age cohort, it can experience rapid economic growth. East Asia's economic growth in the late 20th century was partly driven by this dividend. Critical condition: working-age population must have access to quality education, healthcare, and employment.
Migration is the movement of people from one place to another with the intention of settling in the new location. It is the third driver of population change alongside births and deaths.
Types of Migration: Internal vs. international; voluntary vs. forced; temporary vs. permanent.
Migration results from push factors (conditions driving people away from origin) and pull factors (conditions attracting them to destination), mediated by intervening obstacles (distance, cost, visa requirements, family ties).
Push factors: poverty, unemployment, conflict, environmental degradation
Pull factors: higher wages, political stability, better education/healthcare, existing migrant communities
Consequences of Migration:
Used by countries concerned about population decline or aging. France: generous family allowances, subsidized childcare, long parental leave. Hungary: substantial financial incentives for families with multiple children, mortgage relief, tax exemptions.
Used by countries concerned about overpopulation. China's One-Child Policy (1980-2015): restricted most urban couples to one child. Dramatically reduced birth rates but created aging population, distorted sex ratio, shrinking workforce. Moved to two-child (2016) then three-child (2021) policy. India: voluntary family planning programs with mixed results.
Population is not just a number. It is the sum of billions of individual lives, each shaped by geography, by the land available to farm, the city offering work, the conflict forcing movement, the healthcare system extending life, or the poverty cutting it short.
The patterns of population distribution and change we see today are the product of centuries of accumulated decisions, agricultural, industrial, political, and medical. And the patterns changing fastest right now, in aging Japan, in booming Nigeria, in migration-shaped Germany, will define the political and economic landscape of the coming decades.
Population is where physical geography and human geography meet most directly. Understanding where people are, why they are there, how many they are, and how fast that is changing is the foundation on which almost every other geographic question rests.